Carbohydrates to proteins and back: How dietary and cropping diversification seems to have gone into reverse
In 1997, McKinsey & Company and the Confederation of Indian Industry released a report on how India, over the next 20 years, would see a shift in the “centre of gravity” in its food consumption patterns from ‘subsistence’ to ‘basic’ foods. The report didn’t precisely define ‘subsistence’, but the reference was to cereals, sugar and other foods that basically deliver calories and secure the “basis of survival”. The ‘basic’ category, on the other hand, encompassed foods rich in proteins, such as milk and dairy products, egg, meat, fish and chicken
The CII-McKinsey study – Food & Agriculture Integrated Development Action or FAIDA, as it was called – drew upon cross-country evidence to demonstrate that the consumption of ‘basic’ foods begins to grow rapidly when the ‘subsistence’ category plateaus. They found that the inflection point for this is usually at per capita incomes above $1,000 in purchasing power parity (PPP) terms. India’s per capita GDP, then, was only around $415 in current US dollars, but had crossed $1,750 at PPP (https://bit.ly/3ksIlC7). It had already, therefore, reached the threshold where “with rising incomes, what is considered good food comes to accommodate greater diversity”.
The FAIDA report’s prophesy was borne out by household consumption data from the National Sample Survey (NSS) rounds for subsequent years. If ‘basic’ foods are understood to also include fruits and vegetables – these are high in micronutrients, viz. vitamins and minerals – it can be seen that the per capita consumption of all of them have increased, both in urban and rural areas. The resultant diversification of diets – from calories/energy-based to incorporating proteins and micronutrients – is perceptible particularly in the period from 2004-05 to 2011-12 (see tables below)
Per capita consumption of various foods over 30 days: Rural
|
1993-94 |
1999-2k |
2004-05 |
2011-12 |
| Cereals (kg) |
13.40 |
12.72 |
12.12 |
11.22 |
| Pulses (kg) |
0.76 |
0.84 |
0.71 |
0.78 |
| Milk (litres) |
3.94 |
3.79 |
3.87 |
4.33 |
| Eggs (number) |
0.64 |
1.09 |
1.01 |
1.94 |
| Fish (kg) |
0.18 |
0.21 |
0.20 |
0.27 |
| Chicken (kg) |
0.02 |
0.04 |
0.05 |
0.18 |
| Goat meat (kg) |
0.06 |
0.07 |
0.05 |
0.05 |
| Edible oil (kg) |
0.37 |
0.50 |
0.48 |
0.67 |
| Tomato (kg) |
0.29 |
0.35 |
0.34 |
0.59 |
| Onion (kg) |
0.46 |
0.58 |
0.56 |
0.84 |
| Potato (kg) |
1.24 |
1.61 |
1.33 |
1.97 |
| Banana (number) |
2.20 |
2.48 |
2.37 |
4.18 |
| Mango (kg) |
0.06 |
0.10 |
0.09 |
0.16 |
Per capita consumption of various foods over 30 days: Urban
|
1993-94 |
1999-2k |
2004-05 |
2011-12 |
| Cereals* (kg) |
10.60 |
10.42 |
9.94 |
9.28 |
| Pulses* (kg) |
0.86 |
1.00 |
0.82 |
0.90 |
| Milk (litres) |
4.89 |
5.10 |
5.11 |
5.42 |
| Eggs (number) |
1.48 |
2.06 |
1.72 |
3.18 |
| Fish (kg) |
0.20 |
0.22 |
0.21 |
0.25 |
| Chicken (kg) |
0.03 |
0.06 |
0.09 |
0.24 |
| Goat meat (kg) |
0.11 |
0.10 |
0.07 |
0.08 |
| Edible oil (kg) |
0.56 |
0.72 |
0.66 |
0.85 |
| Tomato (kg) |
0.46 |
0.55 |
0.53 |
0.81 |
| Onion (kg) |
0.56 |
0.72 |
0.72 |
0.95 |
| Potato (kg) |
1.08 |
1.32 |
1.14 |
1.61 |
| Banana (number) |
4.48 |
5.00 |
4.14 |
6.69 |
| Mango (kg) |
0.12 |
0.16 |
0.11 |
0.20 |
Note: *Includes cereals and pulses products.
Source: National Sample Survey Office.
The tables suggest significant dietary diversification over time, with per capita consumption of cereals declining and that of ‘basic’ foods – containing proteins (milk, eggs, fish and chicken) as well as fat (edible oils) and micronutrients (vegetables and fruits) – going up. Moreover, there was an acceleration of this trend post 2004-05. Pulses and mutton are exceptions here and we will discuss their case again a little later.
The underlying driver of dietary diversification during this period has been incomes. That household consumption tends to shift from ‘inferior’ to ‘superior’ foods with rising incomes is a well-known trend (the FAIDA report talked of ‘subsistence’, ‘basic’ and also ‘premium’ foods. The estimated take-off threshold for the latter was at $7,500 per capita PPP incomes; India’s per capita GDP was $7,000 at PPP and $2,100 at current dollars in 2019). A classic example of a ‘superior’ food is milk, a vital source of animal protein in a country with a substantial lacto-vegetarian population. As incomes rise, the share of milk and dairy products in their total food spend tends to go up, while decreasing for cereals. This can be seen from the shares of the two items in the monthly per capita value of food consumption across different fractile classes (from bottom to top). In rural areas, the value of milk consumption overtakes cereals by the 10th fractile class, while earlier, at 7th, for urban India.
% Share of per capita value of food consumption: 2011-12
| Fractile Class |
Cereals |
Milk & dairy |
| Rural |
Urban |
Rural |
Urban |
| 01 |
32.64 |
28.61 |
5.59 |
9.15 |
| 02 |
30.25 |
24.15 |
7.92 |
11.61 |
| 03 |
28.18 |
22.48 |
10.27 |
13.45 |
| 04 |
26.13 |
20.54 |
10.83 |
15.03 |
| 05 |
24.43 |
18.76 |
12.60 |
15.98 |
| 06 |
22.61 |
17.65 |
13.80 |
16.82 |
| 07 |
21.38 |
17.03 |
14.29 |
17.56 |
| 08 |
19.96 |
15.93 |
15.55 |
17.68 |
| 09 |
18.82 |
14.86 |
16.59 |
18.22 |
| 10 |
17.07 |
13.50 |
18.44 |
17.59 |
| 11 |
15.06 |
11.46 |
19.62 |
17.88 |
| 12 |
12.20 |
7.91 |
18.73 |
14.72 |
| Average |
20.33 |
15.62 |
15.19 |
16.44 |
Source: ‘Household Consumption of Various Goods and Services in India 2011-12’, NSS 68th Round (July 2001-June 2012).
Rising from below
Proof of incomes rising, including at the bottom fractiles/deciles, is rural wages. The accompanying chart shows wages registering considerable growth, both in nominal and inflation-adjusted real terms, from roughly the mid-2000s till around 2013-14, before decelerating thereafter.
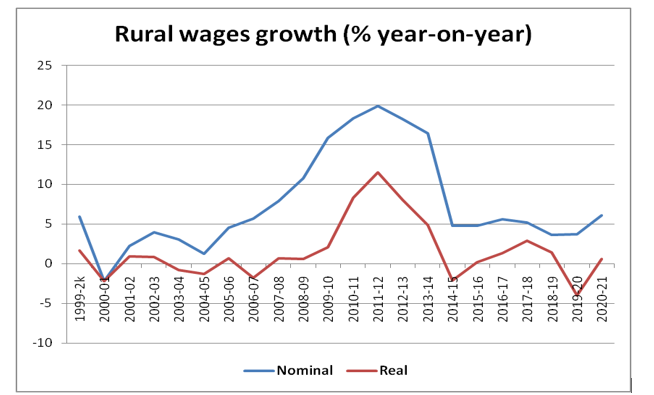
Nominal wages are simple arithmetic all-India average for rural male labourers across 25 agricultural and non-agricultural occupations; for calculating real wages, the Consumer Price Index for Rural Labourers has been used.
Source: Labour Bureau.
Landless rural daily wage farm and non-farm labourers traditionally occupy the bottom-most rungs of Indian society. During the seven years from 2007-08 to 2013-14, their nominal wage rates grew by 15.3% per year on an average. But what made this period truly unprecedented perhaps was real rural wages, too, recording an average annual growth of over 5.1%.
The increase in incomes, especially of poor and lower-middle class households, would have been a major contributor to the accelerated trend of dietary diversification, evident from the NSS consumption data between 2004-05 and 2011-12. Praduman Kumar et al (https://ageconsearch.umn.edu/record/109408/?ln=en) have estimated the income elasticity of demand for milk in India at 1.64, with these even higher for the “very poor” (2.342), “moderately poor” (2.018) and “non-poor lower” (1.773) households. Every 1% rise in household incomes, thus, generates an average 1.6%-plus additional demand for consumption of milk and milk products. But it isn’t dairy alone: The NSS data reveals per capita consumption of eggs nearly doubling between 2004-05 and 2011-12, while trebling for chicken. Many lower-income households would also have added more fresh produce such as vegetables along with roti and rice to their diets.
A corollary to dietary diversification has been cropping diversification. It can be seen from the table below that India’s output of livestock and horticultural products has shot up anywhere from three (milk, vegetables and fruits) to nine (poultry meat) times since 1990-91, as against hardly 1.1-2 times for cereals, sugar and pulses. Much of this is, again, really reflected only after 2000-01.
All-India production in million tonnes
|
1990-91 |
2000-01 |
2015-16 |
| Milk |
53.92 |
80.61 |
155.49 |
| Eggs* |
21.10 |
36.63 |
82.93 |
| Poultry meat |
0.36 |
0.86 |
3.26 |
| Vegetables |
58.53 |
88.62 |
169.06 |
| Fruits |
28.63 |
43.00 |
90.18 |
| Cereals |
162.13 |
185.73 |
235.22 |
| Pulses |
14.26 |
11.08 |
16.32 |
| Sugar |
12.05 |
18.51 |
25.13 |
*In billion numbers.
Source: Departments of Agriculture, Animal Husbandry & Dairying and Food & Public Distribution.
Three points are worth highlighting here.
The first one is that the above production increases appear to have been supply responses to demand. Second, such responses were the strongest in crops/products where production-enhancing technologies existed. These included seeds/genetics (tissue-cultured plants in banana, hybrids in vegetables as well as maize and fodder grasses for livestock, artificially inseminated crossbred cows, and commercial broilers and layer birds) and agronomy (drip irrigation, laser-leveling, raised-bed planting and high-density cultivation), chemistry (new crop protection chemicals and water-soluble/specialty fertilisers). Their diffusion was further enabled by better roads and availability of three-phase power, making it easier to access markets and viable to invest in irrigation systems, bulk milk coolers, cold stores and deep freezers.
The third point relates to the role of the private sector. The Green Revolution in cereals or breeding of high-yielding sugarcane varieties was mostly the effort of the Indian Council of Agricultural Research and state agricultural universities, while also accompanied by government procurement/enforcement of minimum support prices. The increasing production achieved in horticulture and poultry, by contrast, were in significant measure due to private corporations, such as Jain Irrigation, Syngenta, Bayer, Monsanto, DuPont, Mahyco, Venkateshwara Hatcheries and Suguna. Even in the case of milk, the National Dairy Development Board’s Annual Report for 2010-11 conceded that “it is estimated that the capacity created by them (private sector players) in the last 15 years equals that set up by cooperatives in over 30 years” (https://bit.ly/3kNm2XN).
Another important example of technology and integration is poultry where there was adoption of hybrid Ross-308/Cobb-500 broilers and BV-300-layer birds. There were also large integrated poultry firms supplying not only day-old-chicks, but even feed, medicines and vaccines, to farmers. Similar technology-driven changes in production did not take place in goat and sheep meat, nor with desi breeds such as Kadaknath and Chittagong.
On the other hand, the limited hybridisation possibilities in pulses and oilseeds elicited little interest from private seed companies. Not surprisingly, the supply response to increased consumption demand for vegetable proteins and fat took the form of surging imports rather than domestic production. Between 2000-01 and 2015-16, India’s edible oil imports soared from 4.2 million tonnes (mt) to 15.6 mt. So, did that of pulses, from 0.4 mt to 5.8 mt. This is where the lack of serious public investment in agricultural R&D for oilseeds and pulses has played an important role in India’s dependency on increased imports of edible oils and pulses.
Recent trends
Unfortunately, the picture after 2015 is hazy. To start with, there isn’t any published NSS household consumer expenditure (HCE) survey data after 2011-12. The large sample-size quinquennial HCE surveys (the 68th round for 2011-12 had 101,651 households from 7,649 villages and 5,268 urban blocks across the country) are the most credible source on the monthly per capita consumption of different foods, both in quantity and value terms, over time. The National Statistical Office did undertake an HCE survey for 2017-18 (July-June), but its results weren’t released, ostensibly in view of “data quality issues” (https://bit.ly/3fFfJ55).
The absence of any published NSS HCE information after 2011-12 means we know little on how much dietary diversification has taken place, if at all, in the more recent period. Has the accelerated trend of diversification, noticeable during the 2004-05 to 2011-12 period, continued, stalled or maybe reversed? The 2017-18 HCE survey could have shed some light; unfortunately that data is not publicly available.
But there are some things that we do know.
The first relates to rural wage rates. These, as already seen, grew by an average 15.3% per year in nominal and 5.1% in real terms during the seven years from 2007-08 to 2013-14. The subsequent seven years from 2014-15 to 2020-21, however, recorded a nominal yearly growth of just 4.8% and virtually zero after factoring in inflation. If rural wages are a proxy for incomes of the lowest decile households, these have hardly risen in real terms. Going by the past relationship between incomes and dietary patterns, this would have likely had some negative impact on the demand for protein- and micronutrients-rich foods.
The second has to do with inflation. During 2014-15 to 2019-20, overall consumer price index inflation averaged 4.5% a year, while lower, at 4.1%, for food and even more so in sugar, edible oils, cereals and egg. There was no real “protein inflation” in pulses, milk, meat and horticultural products either. This appears to be a contrast to earlier arguments that protein inflation would be an inevitable consequence of the surge of rising incomes across the population driving increasing demand for proteins. The former Reserve Bank of India deputy governor Subir Gokarn, in a late-2010 paper, estimated that a 39% growth in real per capita incomes between 2004-05 and 2009-10 resulted in the diets of an additional 220 million Indians shifting “decisively” towards higher consumption of proteins. “Increasing demand for proteins appears to be an inevitable consequence of rising affluence,” he wrote, while warning of persistent demand-supply imbalances that would make pulses, milk, eggs, fish and meat much more costly down the line (https://bit.ly/3jAfn0X). The chart below suggests little materialisation of those fears, at least in the most recent period. It would be worth exploring the role of changing incomes and demands in the benign inflationary outcomes story.
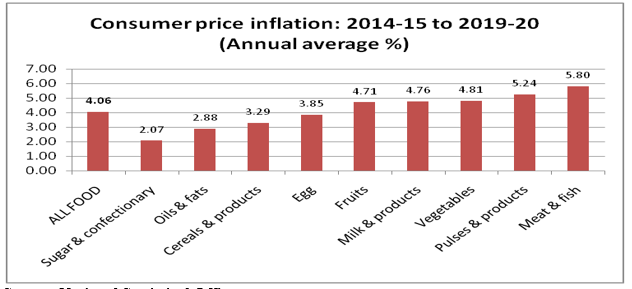
Source: National Statistical Office.
A third indicator pertains to demand. The table below provides data on liquid milk sales by cooperative dairies. These posted an annual growth rate of 5.9% between 2001-02 and 2007-08, rising to 7.6% for 2008-09 to 2013-14. But the compound annual growth during the subsequent six-year-period to 2019-20 fell to 3.9%. This wasn’t due to private dairies faring any better or grabbing market share from cooperatives. Published financial information on 12 major private dairy companies shows their combined sales revenues going up from Rs 13,634.31 crore in 2014-15 to Rs 16,770.35 crore in 2018-19, translating into an annual growth of 5.3% in nominal terms and even less after adjusting for inflation. The so-called private sector’s White Revolution was a post-liberalisation phenomenon that tapered off by 2014-15, with the collapse of global milk powder and fat prices. The companies that have continued to do well are the few focusing on branded liquid milk and consumer products marketing, as opposed to the more volatile dairy commodities business.
Milk sales versus production
|
Liquid milk marketing by cooperatives* |
Milk Production** |
| 2001-02 |
134.23 |
84.41 |
| 2007-08 |
189.60 (5.92) |
107.93 (4.18) |
| 2013-14 |
294.44 (7.61) |
137.69 (4.14) |
| 2019-20 |
370.77 (3.92) |
198.40 (6.28) |
Note: *lakh litres per day; **million tonnes; figures in brackets are six-year compound annual growth rates.
Source: National Dairy Development Board and Department of Animal Husbandry & Dairying.
If sales of organised cooperative and private dairies are anything to go by, the growth in demand for milk and milk products has clearly slowed. It then raises questions on official milk production statistics that point in the opposite direction. This apparent incompatibility between demand deceleration and output acceleration is something only the findings from a fresh NSS HCE can plausibly resolve.
One other data source, which could give some idea of food consumption patterns for the recent period, is the Centre for Monitoring Indian Economy’s Consumer Pyramids Household Survey (CPHS). A longitudinal panel survey covering an all-India sample of 170,000-odd households, it tracks their monthly expenses on 153 items, out of which 43 relate to food.
The advantage with the CPHS is that it has monthly data on household expenditures, both food and non-food, from January 2014. But there are also disadvantages of not all households reporting their consumption every month. What we found from the raw CPHS data was the average household reporting for only 4-6 months in a year. And since each of them reported/non-reported data for different months, it makes calculation of the average expenditure by all households on a particular item, food or non-food tricky. A more serious shortcoming of the CPHS, though, is that it deals exclusively with values – how much money a household spends every month on whole-grain cereals, how much on dal (whole and split pulses), on milk and milk products, on edible oils, and so on. There is no information on the quantities of such items purchased or consumed by the household. The CPHS, to that extent and unlike the NSS HCE surveys, does not tell us much about dietary diversification, which is ultimately about quantities as against only expenditure values.
Within those limitations, what are the results that the CPHS dataset throw up for us to consider? We have taken the average expenditure of all households on different foods as a percentage of their total food spends. These shares have been worked out for all the months from January 2014 to March 2020 (see chart below). Like before, we have confined our analysis to the period before the Covid pandemic and the national/state-level lockdowns, which have produced their own dynamics and require separate treatment.
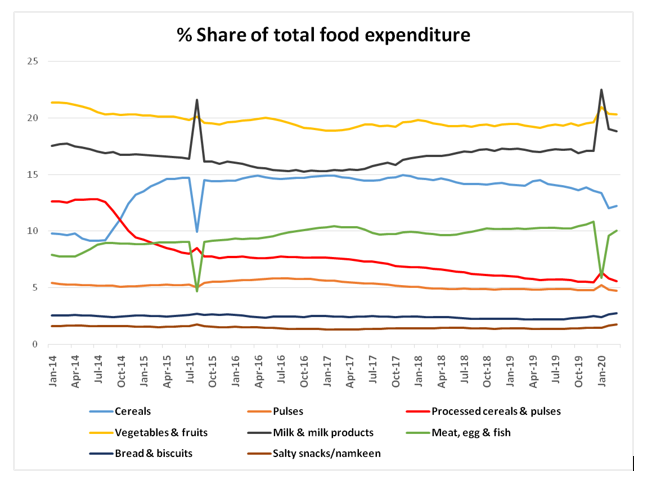
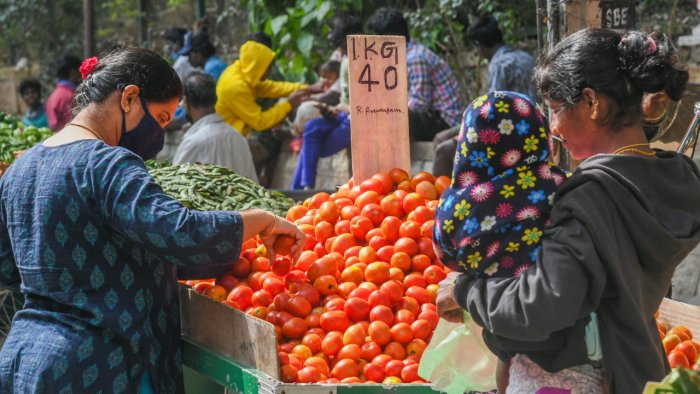
The CPHS shows the share of cereals in the total household food expenditures rising from an average of 10.4% in 2014 to 14.8% in 2017, before marginally falling to 14.1% in 2019 and then to 12.2% by March 2020. While the share of cereals as a proportion of total household food expenditures has gone up by around 2 percentage points during this time (2014 and 2020), there is a sharp decline observed in the share of processed cereals and pulses – atta, sooji, maida, poha, besan and other such flours and puffed/flattened rice products – from 12.6% to 5.6% during this same period. This runs contrary to the predictions of the 1997 CII-McKinsey report that projected a significant jump in household demand for branded ‘basic foods,’ including processed cereals and pulses. It is also worth noting that relative spending on cereal consumption has gone up even as the National Food Security Act (NFSA) of 2013, under which over two-thirds of the Indian population is entitled to receive at least 5 kg of wheat or rice per month at Rs 2 and Rs 3/kg, respectively, has been implemented.
As far as the other foods go, their percentage shares have been flat with occasional spikes (milk, vegetables & fruits, pulses, bread and biscuits and salty snacks/namkeens) or marginally increased (meat, egg & fish). On the whole, given the limitations of the CPHS data on consumption outlined at the outset and the analysis presented above, at best, we can infer that the shares of most foods in household expenditures have remained more or less constant since 2014. But this, again, is in value terms. The CPHS does not reveal if households are consuming more or less quantities of any food over time. The implications are different if a family spends a fixed sum of money on a particular food every month or consumes a fixed quantity of that food, irrespective of price and income movements.
Policy implications
India, during the first decade-and-a-half of this century, experienced a concurrent process of dietary and cropping diversification, mainly propelled by rising incomes. As household purchasing power across all income classes rose, there was an observable shift in the data on consumption patterns, with increasing demand for milk, eggs, chicken, vegetables, fruits and other such protein and micronutrients-rich foods. Farmers and agri-businesses, in turn, responded to the higher demand by ramping up supply. This was reflected in the production growth of dairy, poultry and horticulture sectors far outpacing that of regular cereal crop agriculture.
The limited data points available for the more recent period would make it seem that this largely market-driven process may have since stalled. Only an NSS HCE survey can really confirm that, underscoring yet again the urgent need for such data, especially given the very serious implications for human health and nutrition. When incomes don’t rise, household consumption of protein and micronutrient rich foods such as milk, pulses, fresh fruits and vegetables, meat and eggs, become unaffordable relative to those high in calories/carbohydrates such as rice, wheat and sugar.
There are also serious implications for agricultural production and diversification. When farmers don’t see enough market demand for livestock, poultry and horticultural products, they are likely become more risk averse and go back to cultivating crops where minimum yields and price support are assured: paddy, wheat and sugarcane. Both wheat and rice stocks in the Central pool were at record highs of 60.36 mt and 49.11 mt as on July 1, 2021, and way above their respective minimum required levels of 27.58 mt and 13.54 mt for this date. The same goes with sugarcane, where delayed payments by mills haven’t stopped farmers from persisting with this sturdy crop that can withstand “ola (hail), pala (frost), aag (fire), paani (floods), nilgai (Asian antelope) and jangli suar (wild boar)” (https://bit.ly/3fY8cPf).
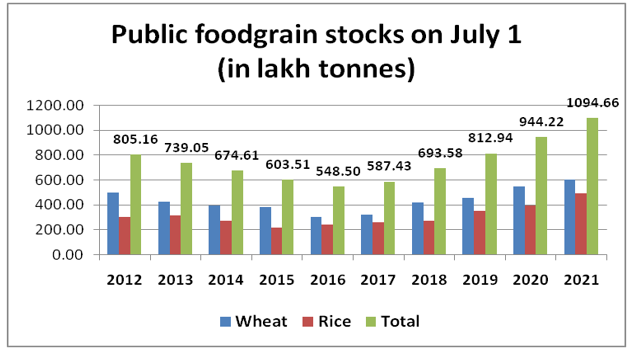
Source: Food Corporation of India.
The reality of the present demand situation, especially post-Covid, needs to be reckoned with. Official production estimates in milk, for instance, appear wholly out of sync with data on sales by organised cooperatives as well as private dairies. To reiterate an earlier point, only an NSS HCE survey can give a clear picture of consumption of various foods and make demand forecasts based on that. Such surveys should ideally be carried out every year, like the Period Labour Force Surveys from 2017-18, even if with smaller sample sizes. This is important both for crop and nutritional planning. Without data on what and how much Indians are consuming, how can there be any credible policymaking or projections for the future?
Secondly, the time has come to look at dietary and cropping diversification without assuming that this will simply and inevitably be ‘market-driven’ and sustained. It would mean redesigning policy currently biased towards production of crops that primarily meet energy needs, as against foods delivering more wholesome “nutritional security”. Moving from basic “food security” to “nutritional security” requires overhauling the governmental procurement and public distribution system. As a range of voices have been pointing out, this would require well-considered and supported transitional policies and systems to be put in place and should prioritise and reallocate resources (including Minimum Support Price-based procurement) towards pulses, millets, vegetables, milk and eggs. A centrally-funded decentralised system of procuring and distributing these foods, both through fair price shops as well as Integrated Child Development/Mid-Day Meals Scheme can play an effective role in combating endemic hunger and malnutrition.
Policy interventions of this kind, however, have their own considerable challenges and if built on the assumption that state policies like procurement alone can shape and sustain demand or production without a whole range of unpredictable effects, they are likely to cause other grave problems down the line. But new strategies and systems are urgently required, and these will need much deeper engagement and understanding of the dynamics of income, consumption, demand, dietary diversification, agricultural production and distribution.
This note, part of the Understanding the Rural Economy series by CPR, has been authored by Harish Damodaran, Mekhala Krishnamurthy and Samridhi Agarwal.
Find all previous notes as part of the series here: