Air pollution in Indian cities: Understanding the causes and the knowledge gaps
Navroz K Dubash
December 14, 2017
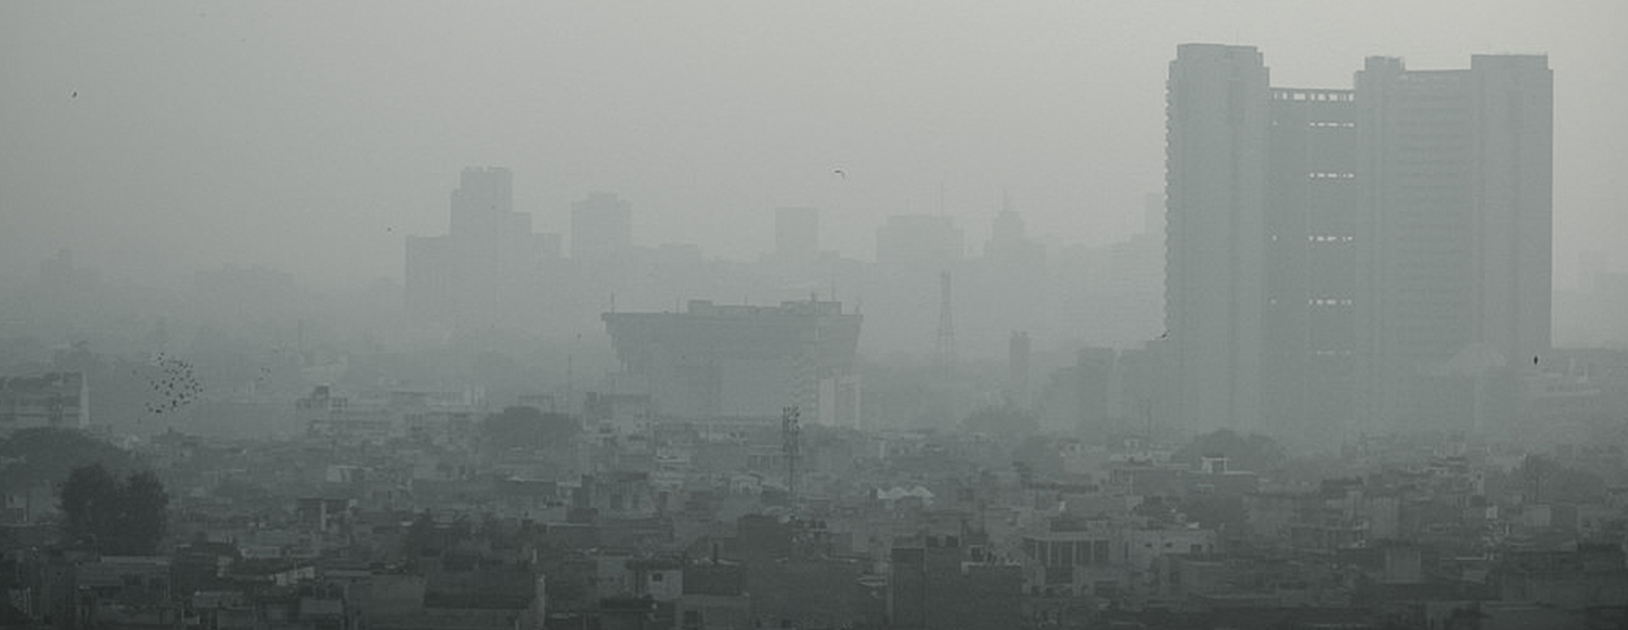
For the past few months the National Capital Region has been experiencing hazardous air quality. In this Q&A session with Dr Sarath Guttikunda, we try to understand the various sources of air pollution in Indian cities, particularly in Delhi, and why PM 2.5 has to be the focus of policy measures. We also ask him about the episodic concern for air pollution in India and the country’s capacity to monitor ambient air quality.
Dr Guttikunda is the founder/director UrbanEmissions.Info (UEinfo, India), a NASA Earth and Space Science Fellow; and a TED fellow.
What are the main sources of air pollutants?
Of the pollutants, PM 2.5 exceeds the standards the most, followed by PM 10, NO2, CO, and Ozone. The only pollutant to comply the national standards is SO2. Sources of each of these pollutants vary, in terms of percent contributions from various sources.
However, the main sources contributing to air pollution are well identified and this list is common for all Indian cities – vehicle exhaust, heavy industry including power generation, small scale industries including brick kilns, resuspended dust on the roads due to vehicle movement and construction activities, open waste burning, combustion of various fuels for cooking, lighting, and heating, in-situ power generation via diesel generator sets. Additionally, seasonal influences from dust storms, forest fires, open field fires during harvest season, and sea salt near coastal areas. In Indian cities, a major part of air pollution is sourced, all year around, from burning of diesel, petrol, gas, coal, biomass, and waste and resuspended dust.
Based on the material available from source apportionment studies, we summarized the nature of air pollution and sources in India, in this 2014 publication – Nature of air pollution, emission sources, and management in Indian cities.
For Delhi, based on the information available and our modelling studies, we assess, to ambient PM2.5 pollution, the contributions of
Vehicle exhaust is up to 30%
Biomass burning is up to 20%
Soil and road dust is up to 20%
Industries is up to 15%
Open waste burning is up to 15%
Diesel generators is up to 10%
Power plants is up to 5%
Outside the urban airshed is up to 30%
More details on studies included in this assessment available at What’s Polluting Delhi’s Air?
How are these sources identified and studied?
Attributing source contributions is an involved process, with a lot of data needs, an understanding of the primary sources in the city, information of ambient pollution levels, geography, and meteorology, and a lot of computational capacity to analyse the information in both real time and hind cast. A summary of these approaches involved in this process are detailed in our primer on source apportionment.
When there are many different types of air pollutants, why do we focus on PM 2.5? Why is it particularly dangerous?
A chemically charged pollutant, PM has contributions from all the primary emissions.
Black carbon and organic carbon, as primary emissions are part of PM 2.5
SO2 undergoes chemical reactions to form sulphate aerosols, which is part of PM 2.5
NOx-CO-VOC combine and react in many ways to chemically transform to form nitrate and secondary organic aerosols, which are part of PM2.5
NOx-CO-VOC also combine and react in many ways to form and consume ozone (depending on the mixture of the gases), which also contributes to health impacts and also participates in the formation of nitrates and secondary organic aerosols, which are part of PM 2.5
So, if we target PM 2.5, the one pollutant we are mainly concerned about in India, we are invariably targeting all the other pollutants as well. Therefore, any control mechanism aimed to reducing direct PM 2.5 emissions also reduces other pollutants (since sources to all these pollutants are common), except for resuspended dust.
The particle size, less than 2.5 micro-meter, is small enough to enter our lungs and blood stream, and stay there for a long time. There are more studies linking PM 2.5 to various health risks than any of the other pollutants.
Are Delhi’s pollution levels unsafe?
Annual average PM 2.5 levels in Delhi is 150 mg/m3. India’s national ambient air quality standard for PM 2.5 is 40 and World Health Organization’s annual guideline is 10. It is very clear that Delhi’s pollution levels are in the unsafe category.
While the pollution levels in Delhi have been in the same “very poor” range for the past five years, from the news coverage of the issue in the last two years, it is evident that the public interest in the topic is at its peak this year. Only concern is that the interest in the topic from the media and from the public seems to peak only when the pollution levels are in the “emergency” range.
We hear about air pollution particularly in winter months, and after events such as crop burning or Diwali. Are these the only times we should be concerned?
Meteorology over the Indo-Gangetic plains is complicated and it plays a strong role in the observed seasonal cycle of air pollution in the cities in this region – with the winter time highs (due to high inversion) and the summer time lows (due to rains).
While meteorology plays its part, there is also an increase in the total emissions during the winter months, which further exaggerates the problem. These additional emissions are primarily from the burning of wood, coal, and waste for space heating as the temperatures drop. While the need for space heating is there for most part of the winter season, there are also episodic spikes from bursting of crackers during Diwali, which lasts for 2-3 days as well as crop residue burning, which lasts for 2-3 weeks.
The graph presents a summary of monitoring data from Delhi for a period of 45 days from 19th October 2017. While the peaks during Diwali festivities and the crop residue burning emissions reaching Delhi (compounded with meteorological effects due to slow moving winds) are around 800 mg/m3, the running average for the period of 45 days is the most worrisome. Anytime, we normalize the problem looking at the high episodes that occur for 2-3 days or 2-3 weeks in a year, we are neglecting the fact that air pollution is in the very poor to severe conditions for a large part of the season and the year.
An interesting perspective from two colleagues:
Source: twitter
Do we have adequate information on air pollution in India? What do we need to improve the quality of this information?
An excerpt from an article recently published in ‘The Wire’ – It’s About Time We Got Smarter About Monitoring Our Air Pollution (9th September, 2017):
The quality of air in India is bad and is becoming a serious public health issue with huge repercussions to our quality of life and economy. We know this through anecdotal evidence and through the little data on monitoring that trickles down to the public. This limited information is not enough – to formulate policy, to understand seasonal and diurnal variations, to tease out patterns or to calibrate forecasting models. It is the right of any citizen to have access to information on the quality of air she is breathing – monitoring data that is real-time, reliable and accessible to any citizen.
While the results of the GBD study do fill in this lacuna of information, it is not a substitute for real-time information. These results are obtained through a modelling exercise that combines satellite feeds, emission inventories and historical monitoring data to then estimate ground-based concentrations. Note that satellites neither measure one location nor take ground measurements at all times (orbital satellites create a snapshot of the entire planet every one or two days). These snapshots are interpreted using the global chemical transport models to better represent the vertical mix of these measurements (known as aerosol optical depth). Like any modelling exercise, this data also comes with uncertainty. While this process is very useful in establishing annual trends, these systems are not a substitute for daily on-ground monitoring.
What we need are ground measurements using reference methods approved by the environment ministry. This ensures that the monitoring information is reliable and conforms to the government’s standards. Low-cost sensors do provide some information but because many of them are not recognised by the government or are not calibrated accurately, the data they generate cannot be used for policymaking.”
In India, we estimate that we require around 4,000 continuous monitoring stations to spatially and temporally represent the air pollution problem – 2,800 in the urban areas and 1,200 in the rural areas. Currently, data when available comes from around 600+ manual stations and less than 100 continuous monitoring stations.
Among all the cities and states, most number of continuous monitoring stations are present in Delhi, which means there is more information coming from Delhi, there are more studies by national and international institutions on Delhi, and there is more media and public focus on the issue of Delhi. It is very important to understand that air pollution is a regional problem. We need to focus on regions in the country, where people are exposed to unsafe levels of pollution, and there are no monitors to determine how much that is.
Dr Guttikunda recently presented at the first seminar in the Clearing the Air Seminar Series, organised by the Initiative on Climate, Energy and Environment (ICEE) on 4 December 2017 at the Centre for Policy Research (CPR). The full video of this seminar and the subsequent discussion can be found here.